
Thanks to some collaborative work with our friends at Progressive Insurance, we’ve got the results of some very interesting analysis on the distribution of car makes by state or territory using the data from the 2012 Survey of Motor Vehicles by the ABS.
Simply select the car make you are interested in and the map will show you the total number of vehicles registered in each state and the penetration – the number of that model of car against total vehicle registrations.
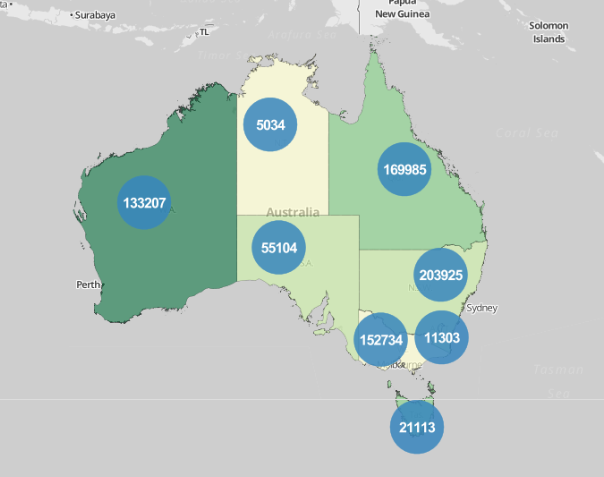
Here are a few interesting examples:
South Australia is the hotspot for Holden ownership. In fact there are nearly 50% more Holdens per head of population, than you would find in Queensland. Loyalty to local manufacturing perhaps?
Are the British expats in Western Australia responsible for the high penetration of Land Rovers?
And if you own a Citroen and live in the Northern Territory… well you’re one of only 35!
It’s an interactive map so please have a play around with the figures and see . Choose a make on the left-hand-side, check out the numbers of vehicles registered then hover over each state to see the percentages.
Pop back here and let us know what you found!